Hello, this is news jelly.
This overseas article related to data visualization is about Oculus Rift, a company called Space-Time Insight.
<datanami>
Alex Woodie
Articles dated March 9, 2015
Virtual Reality Lens for Big Data Visualization
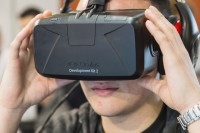 Visualization tools such as Tableau and QlikView have become essential to discover and define trends hidden in data. Now, Space-Time Insight, Inc., has a new level of data visualization with a virtual reality headset called Oculus Rift.
Space-Time Insight is a Silicon Valley company that helps make utilities, logistics companies, oil and gas companies, federal agencies using electric grids and delivery vehicles, and drilling rigs more efficient. The company’s belief, “Things Intelligence for the Internet,” gives hints as to what the company is doing.
The company’s key product is the Situation Intelligence (SI) server, which allows special or transient aspects of large data sets to be understood. The software is designed to allow users to avoid anomalies such as not being able to call home with a voltage spike on a grid or water meter hidden in the data and associating it with other elements such as a property maintenance history or a customer’s payment history Help you find.
In addition to the behavioral prediction model, the software also displays the results of the analysis on interactive maps such as Google Earth and Esri products. This provides the power to enable massive real-time visualization seen in the grid operating walls of California’s Independent Systems Operational (ISO) Operations Center in Folsom.
This is all about turning large data into small data that can be digested by an individual, 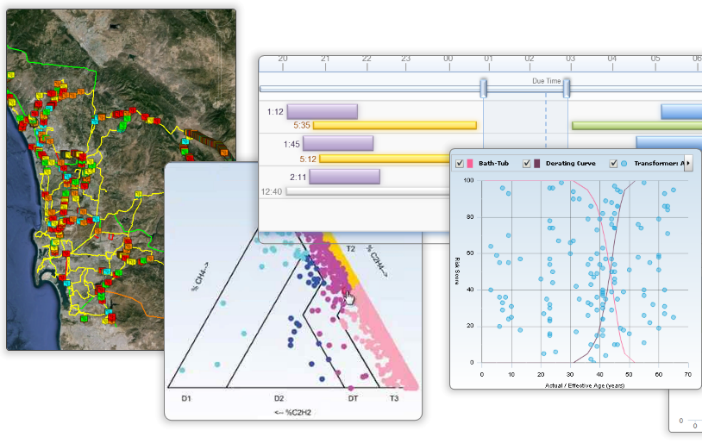 said Steve Ehrlich, director of marketing and product operations .
“We collect all the data, process it in memory, and deal with large volumes of data frequently. And, according to the analysis, we decide what to show to the user, “he said. “This is a collection of information for real users. Because they are making decisions based on isolated, limited information about what is happening. “
The SI server allows decision makers to see as much information as they need. “We need users to see ‘this needs to be focused’ or ‘you’ll have to fail because this will fail’ or ‘there’s a typhoon coming. I’m trying to help you understand things like ‘I’m showing you where to put your colleagues before the typhoon comes here.’ ” “So we can help users define important parts of information, such as breaking away from Big Data and analyzing the point of pure data, or the information they need to focus on.”
Space-Time Insight explains how the R and Python algorithms, and how the customer affects a small fraction of the electricity grid operated by Southern California Edison, or how traffic patterns affect the number of FedEx deliveries, We have a domain expert who can help you predict if a particular event will not happen. Data sources such as satellite photos of local sites and Google’s real-time traffic information play a decisive role in creating good analysis and driving good decision-making.
좋은 의사결정을 하기 위하여 데이터를 모으는 것은 어렵다. 그래서, 당신은 이것이 Space-Time의 특징이라고 말할 수 있을 것이다. “바람과 날씨, 그리고 기업정보와 같은 비구조화된 정보를 연관시키는 것은 어려운 일입니다” Ehrlich가 말했다. “우리는 특히 무엇이 가까이에 있는지 이해하는 것, 그것을 단기적으로 분석하는 것, 현재는 무슨 일이 일어나고 있는지 그리고 미래에는 무슨 일이 일어나게 될 지에 대하여 데이터를 분석하는 일을 가장 잘합니다.”
고객은 정기적으로 SI 서버에 30개 혹은 그 이상의 소스로부터 온 데이터들을 고속으로 처리해서 연관시켜 달라고 요청한다 때때로 이것은 잘 할 수 있다, 그러나 가끔은 그렇지 않다. 대부분, 정보의 질에 의하여 결정되는 것이다. 그러나 문제는 정보의 질이 특정한 경우에만 좋다는 것이다.
“자산 행동과 같이 쉽게 이해될 수 있는 것들에 관한 한, 이 모델은 정말 좋습니다” Ehrlich가 말했다. “그러나 당신이 날씨와 같은 것을 가지고 있다면, 그것은 완전히 다른 이야기입니다. 왜냐하면 아무도 날씨를 성공적으로 예측할 수 없디 때문입니다. 우리는 우리의 분석에 날씨도 확실히 포함하고 있지만, 우리는 또한 이용자들에게 신뢰도를 제공합니다.
좋은 시각화를 가지는 것은 Space-Time Insights가 하는 일에 결정적이다. 이것이 Oculus Rift의 VR 헤드셋의 사전 제작 세트를 진행할 때 회사가 무엇을 했는지 보는 것이 흥미로운 이유이다.
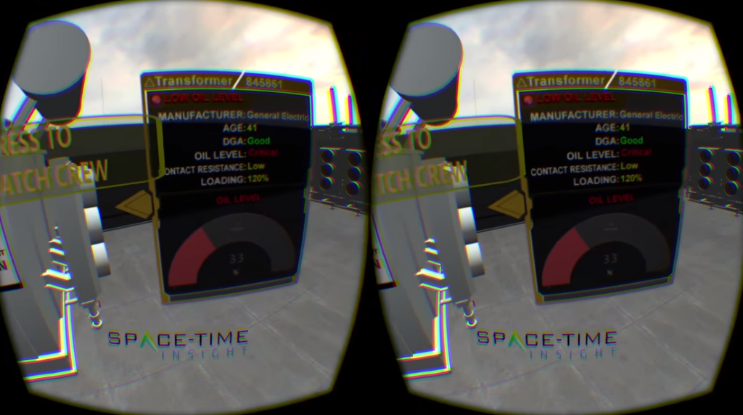 회사는 Oculus Rift의 VR 시각화를 최근 샌디에고에서 열린 산업 컨퍼런스에서 시연했다. 참석자들은 이용자가 전기변전소를 산책하고, 전기 변압기를 검사하는 경험에 대하여 깜짝 놀랐다. 변압기에서 가져온 정보는 새로운 경지의 상호소통을 제공하며 VR 헤드셋을 통하여 보여졌다
“사람들은 그런 종류의 경험을 피할 것이다” Ehrlich가 말했다. “당신이 화면 위에 있는 무엇인가를 볼 때, 그리고 그것이 복잡한 문제라면, 당신은 그 문제의 근본 원인에 대하여 알기 위하여 수 많은 화면을 클릭하며 거쳐가야 할 것이다. 반면에, 나는 VR을 통해서 담배를 피면 연기가 나오는 것처럼 즉시 무엇이 문제인지에 대하여 알 수 있었다.”
Space-Time VR 시각화가 여러개의 시나리오에서 사용될 수 있을 것이라고 예견했다. 이것은 트레이닝에 아주 유용할 것이다. “재산이 어떻게 생겼는지와 어떤 종류의 데이터를 생산해내고 있는지를 보기 위하여 누군가를 변전소의 안으로 데려갈 수 있는 능력은 거대한 이점이 될 것이다.”그는 말했다. 또한, 지상의 항공 엔지니어와 기내에 있는 기장이 협력하여 고장난 부품을 찾아내는 것과 같은 실시간 문제해결에도 사용 될 수 있을 것이다.
만약 이것이 빅데이터, 발전된 분석, 그리고 시각화의 조합이 가고 있는 방향을 보여주는 것이라면, 좀 더 거칠게 나아가야 할 것이다.
“Five or ten years ago, visualization tools were not designed for this much data. So we are looking for new ways to deal with huge amounts of data, such as virtual reality or game technology. “Ehrlich said. “The Big Data world has a lot of this kind of technology. This also means that the Internet of Things is gradually coming to life. “
News jelly that delivers quick news with big data, public data, and social data
