Hello, this is news jelly.
The sixth overseas article related to data visualization is related to the area chart.
<VISUAL NEWS>
January 19, 2015 article Benjamin Starr
Data Visualization 101: Area Chart

Our Data Visualization 101 series covers each chart type to help you refine your data visualization skills.
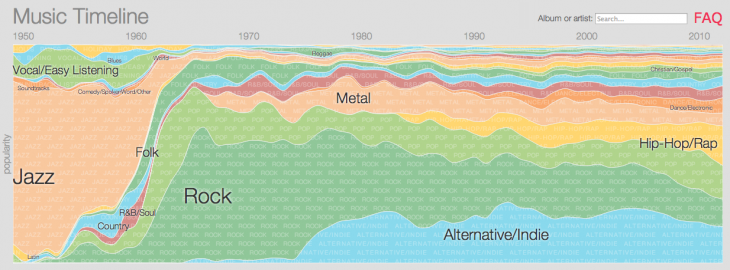
As the mountains are gathered, the area chart shows the change over time. There are a few chronological chart types that you can use to communicate well when you look at charts that show monthly income for the private sector or when you look at the popularity of music genres from the 1950s . Now let’s look at how area charts can be used.
Google’s music timeline uses area charts to showcase the popularity of different genres.
What is an area chart?
The area chart describes the relationship in time order. But unlike line charts , they can also express quantities visually. The information is graphed into two spaces using the data points connected by line classification. The area between the axis and this line is usually emphasized by color or readable contrast processing. Often, most area charts are compared to more than one category.
history
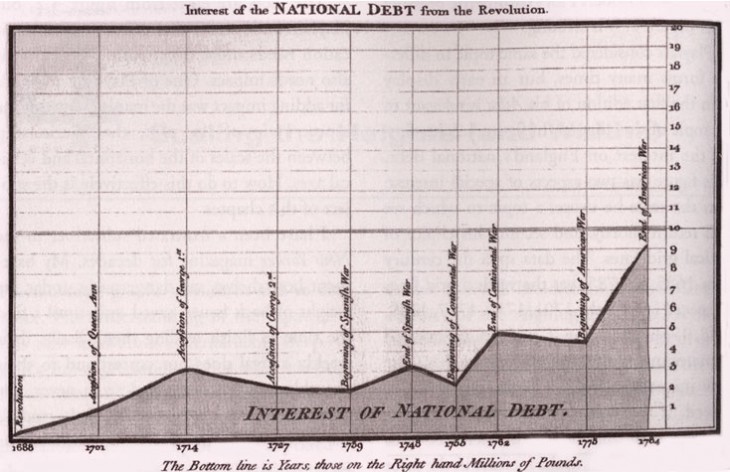
If you have read other articles in this series, you will find that William’s Play Fair is a major innovator in developing pie charts , bar charts , and area charts.
“Commercial and Political Atlas of 1786” showed the first area chart.
언제 면적차트를 써야 할까
면적차트는 개별적인 가치와는 반대되는 전체적인 트렌드를 커뮤니케이션할 때 유용하다. 겹겹이 쌓인 면적 차트는 일대다 관계의 다양한 데이터 시리즈를 위해서 혹은 누적된 데이터 시리즈를 위해 사용한다. 이 차트에는 3가지 변형이 존재하고, 각각은 상황에 따라 최고의 유용성을 발휘한다.
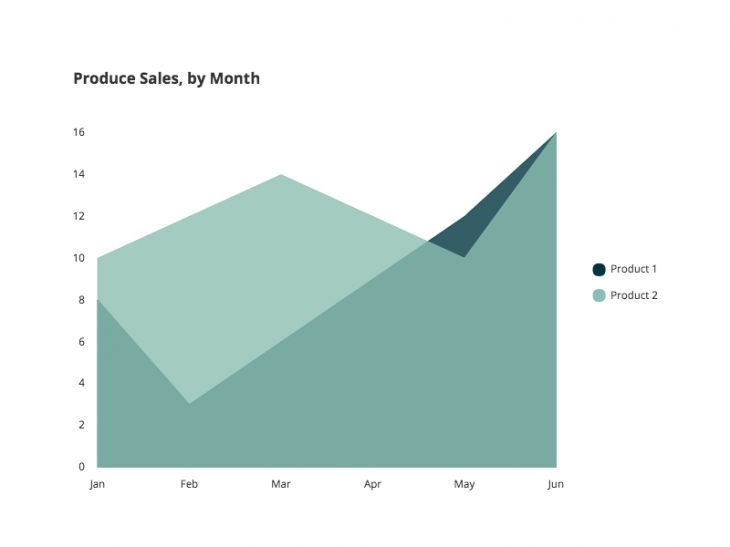
기본적인 면적 차트 : 시간의 진전에 따른 양적 진전을 보여주거나 비교할 때 최고로 유용하다. 많은 데이터 시리즈가 그래프화 되어야 하는 케이스에서는 선 차트가 보통은 더 뚜렷한 선택이다 (아래에 있는 숨겨진 데이터 포인트의 디자인 팁에 대한 솔루션을 보라).
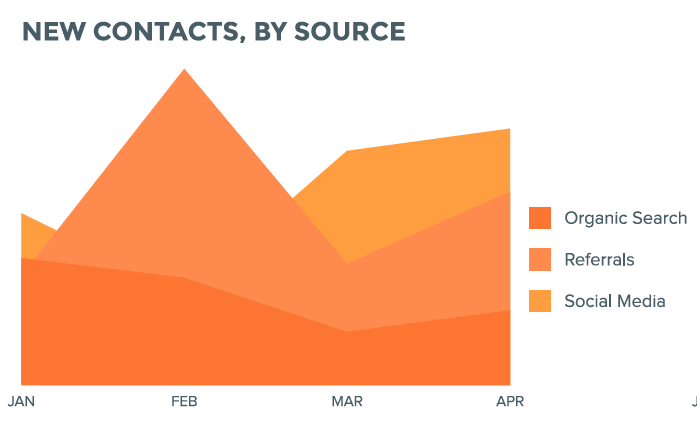
누적된 면적 차트 : 이 차트는 각각의 카테고리가 누적된 전체에 대해 어떻게 공헌하는지 보여주는 것을 도와주면서 일대다 관계를 시각화 할 때 최고로 유용하다.
100% 누적된 면적 차트 : 이 차트는 누적된 전체가 중요하지 않은 곳에 카테고리의 분배를 전체의 부분과 같이 나타낼 때 최고로 유용하다.
면적 차트 제작을 위한 팁
면적 차트는 놀라울 정도로 유명하지만 적절한 디자인 없이는 묘사되기 힘들다. 언제나 최고의 연습이 따른다는 것을 명심하라.
1. 읽기 쉽게 하기
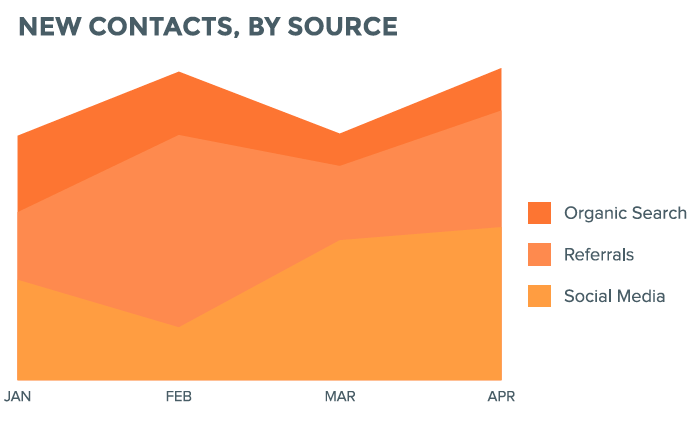
누적된 면적 차트에서, 포지션 카테고리에 따라 데이터를 정렬할 때는 분명하게 구별이 가능한 데이터를 차트의 윗부분에 위치 시키고 구별도가 낮은 것은 아래에 위치 시킨다.
 2. 투명한 컬러 이용하기
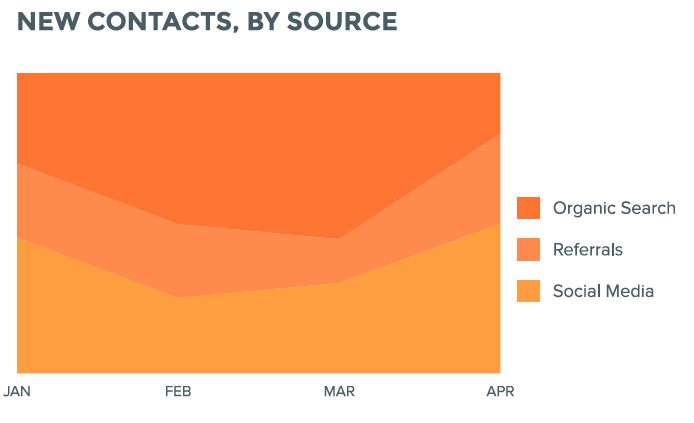
기본적인 면적 차트에서 확실한 데이터는 백그라운드에서 분명하지 않다. 생각을 깊게 하여 순서를 정리하고 투명한 컬러를 활용하라.
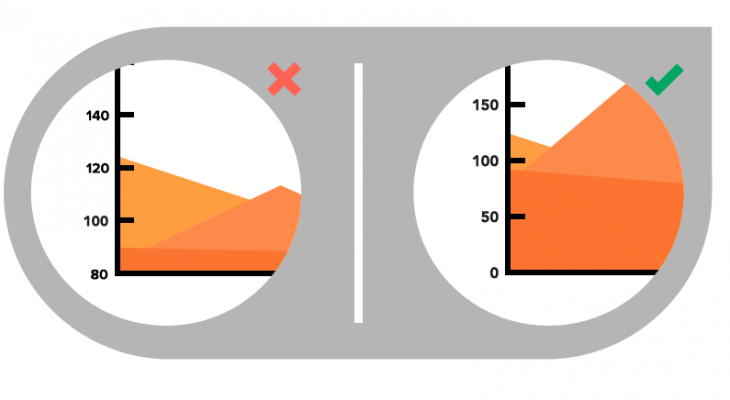
 3. Y축을 0점에서 시작하기
Starting the axis at a point higher than 0 shortens the length of the visualization of the value.
Want to know more? Read pie charts, bar charts, and line charts.
If you want to know more about how to design your data, download a free e-book from Visage (where this post first appeared ) .
News jelly that delivers quick news with big data, public data, and social data
