Hello, this is news jelly.
This article is an overseas article related to data visualization.
(Source: http://goo.gl/YudnB0 )
Modified July 10, 2015
World Wide Web (WWW)? A world map drawn back to the number of Internet users BY. George Arnett
The Oxford Internet Organization (OII) visualized the online population on earth. This shows that Internet use is concentrated in Europe and North America.
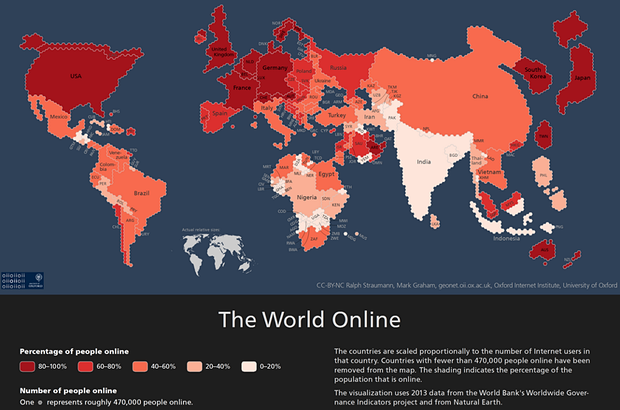
Researchers at the Oxford Internet Organization (OII) created a map of the size of each country in 2013 with the number of Internet users.
A hexagon on the map represents 470,000 Internet users. In addition, according to the proportion of the online user population, each country was colored. For example, the small, white spot on top of China represents Mongolia.
이 지도는 인구 밀도를 부분적으로 반영하는데, 특히 인도와 같은 나라를 주목하게 한다. 인도는 1억 9천만 명의 인터넷 유저들이 거주하지만 모든 시민들이 인터넷을 이용하게 하려면 여전히 갈 길이 멀다.
OII는 블로그 포스트에서 이러한 모순을 강조한다:
“세계에서 가장 큰 나라들은 인터넷 사용 최고 수준(사용률 80% 이상)에 거의 도달하지 못한다.
전 세계 인터넷 사용 수준 분포의 20% 중에 적어도 1000만 명 이상이 살고 있는나라들만 살펴보면 (사용 수준이 높은 순서 순으로) 네덜란드, 영국, 일본, 캐나다, 한국, 미국, 독일, 호주, 벨기에, 그리고 프랑스였다. 대개 유럽과 북아메리카국가들이다.
매우 작은 국가들을 제외하고, 80%가 넘는 인터넷 사용률을 보이는 5개 국가는 유럽, 북아메리카, 또는 오세아니아 대륙에 있다. 그 밖에 일본, 한국, 바레인, 카타르, 아랍에미리트가 예외로 있다. 2011년 최고 수준의 인터넷 사용을 보이는 국가 중에서 유럽이나 북아메리카 대륙을 제외한 국가는 카타르와 한국이 유일했다.”
또한, OII가 이 자료를 통해 2011년 이후로 몇몇 아프리카 국가에서 인터넷사용이 크게 증가해온 것을 볼 수 있었다.
인터넷 사용자 비율은 남아프리카에서 14.9% 포인트, 케냐에서 11% 포인트, 모로코∙이집트∙나이지리아에서 10% 포인트 올랐다. 하지만 47개 중 29개의 남 사하라 아프리카 국가들이 여전히 10% 미만의 인터넷 사용률을 보이고 있으며, 2011년에서 2013년까지 별 증가도 없었다.
This data was provided by World Bank, which has been measuring the number of Internet users in each country since 1990. In addition, the most recent map shows that only one-third of the world’s population can access the Internet.
Cartogram is a useful way of assigning data to a map. Using katograms, you can tweak the size and other elements of the population while maintaining the approximate geographic features of the map. (The Guardian used this method to guide the British election.)
* You can get a more detailed look at the OII map by linking to the original article.
Data visualization specialist, news jelly http://newsjel.ly/
Big data analysis based on data visualization with a flimsy idea
Storytelling content for the world
Facebook address: www.facebook.com/newsjelly
