Hello, this is news jelly.
This article is an overseas article about data visualization.
(Source: http://www.economist.com/blogs/graphicdetail/2015/11/taking-europe-s-pulse)
November 13, 2015 article
Still, many people are paying attention to the economic situation in Europe.
Introducing interactive charts that are easy to understand at a glance!
There have been a lot of visualizations about the European economy in the meantime, but the charts are designed to be easy to understand from a user perspective.
It is recommended that you directly check the interactive chart through the original text of the article ^^
Europe’s Economy in an Interactive Chart
The economies of the 19 eurozone countries are recovering, but the pace is slowing down.
Since the spring of 2013, the first quarter of this year saw a 0.5% growth rate from the fourth quarter of last year.
However, the growth rate declined again to 0.4% in the second quarter and to 0.3% in the third quarter.
This is disappointing given the two opportunities that the eurozone countries have been able to anticipate.
First, the decline in energy prices due to the oil price slump has had the same effect as the tax reduction, contributing to consumption stimulation, which is the driving force of the economic recovery.
Second, the European Central Bank has been pursuing a quantitative easing policy to purchase liquid assets from the market in March and to supply liquidity to the market.
The euro has weakened in the process of helping exporters and achieving a current account surplus of 3.7% of GDP.
Europe will not advance in the present situation if the recovery progresses at a slow rate like now.
One can think of two things: one can be hit by the slowing growth of China and developing countries, which account for 25% of the eurozone export market.
In particular, Germany, which has shown high profitability in the Chinese market through investment goods and exports of luxury cars, will have a large impact.
As the production of industrial products has already decreased in the third quarter, orders for German products are also decreasing.
The other is that the European Central Bank will further relax monetary policy in the future.
As a consequence of paying a lot of money for refugee situations, fiscal stimulus has to be reduced in size, especially in Germany.
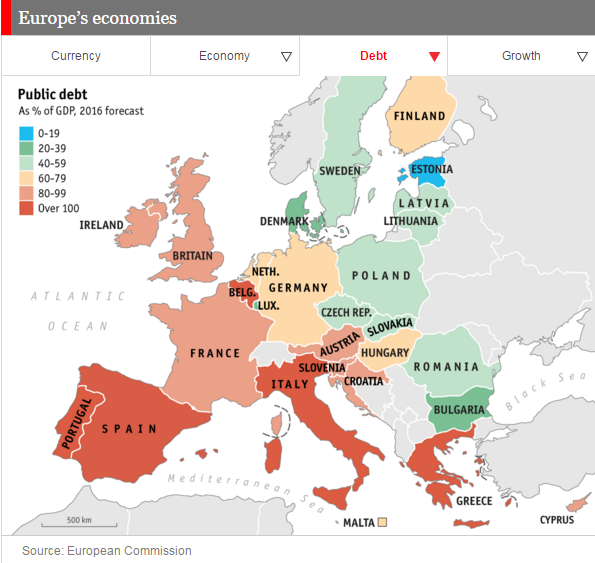
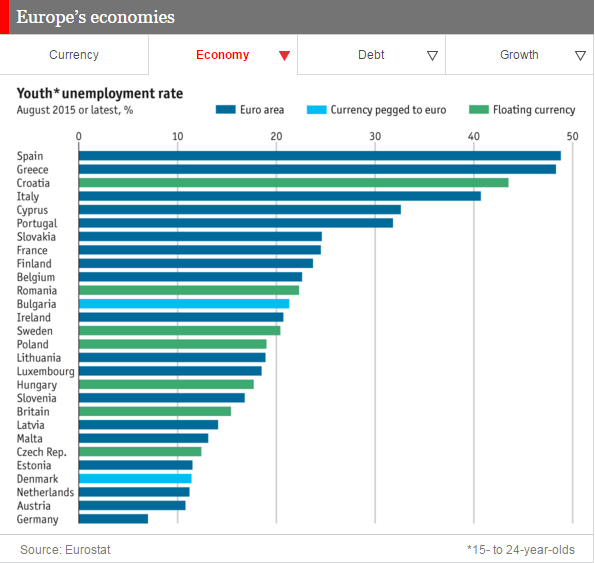
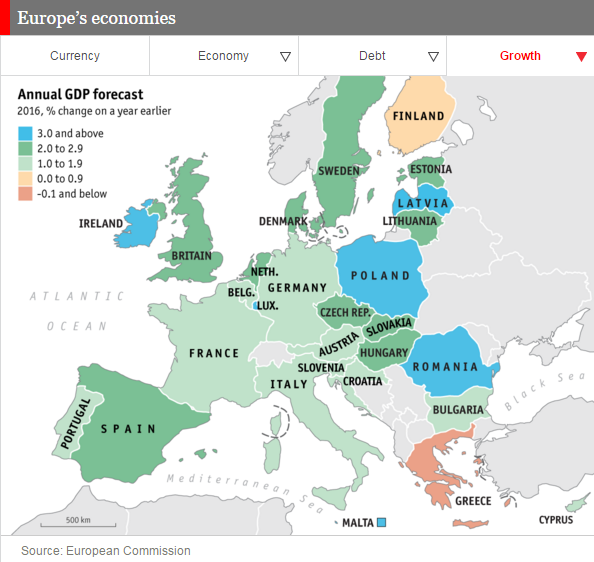
The interactive graph presented above can help you identify the various aspects of the current European economy.
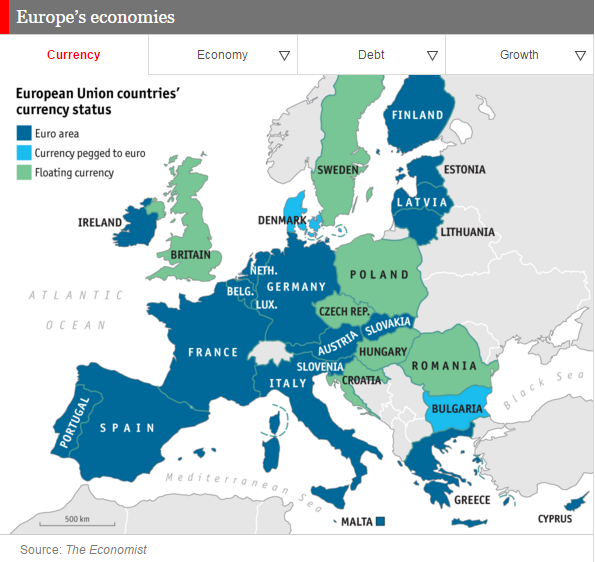
It provides information on national financial conditions, such as employment rates, unemployment rates and GDP, and includes information on nine countries that are members of the EU but are not subordinated to the euro.
Data visualization specialist, news jelly http://newsjel.ly/
Big data analysis based on data visualization with a flimsy idea
Storytelling content for the world
Facebook address: www.facebook.com/newsjelly
